Documentation
Conceptualization
The Latin American Left-Leaning Populism Index (LALLPI) measures active left-leaning populism by combining rhetorical populism with active policies. This approach allows the index to differentiate between (a) leaders who engage in populist rhetoric without implementing corresponding actions, and (b) typically populist policies enacted by non-populist leaders. For example, two governments may have leaders with similar populist rhetoric, but only one may be actively pursuing policy changes. Alternatively, two leaders may enact similar policies (say income distribution), but only one of them does so for populist reasons.
The index is calculated using a combination of populist rhetoric (POP_R) and policy scores. On its most basic form, the index (POP) equals $rhetoric × policy$, where rhetoric ∈[0,1] and policy ∈[0,100] go from less to more populism.
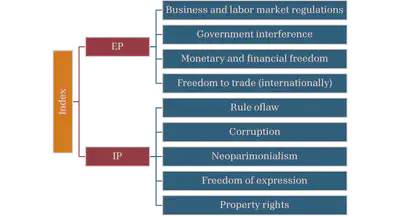
Active populism comprises two sub-indices: Economic Populism (EP) and Institutional Populism (IP). This categorization aims to capture the independently capture the political side and the economic side of populist regimes. EP focuses on the typical economic policies implemented by a populist regime, while IP examines actions against the rule of law and democratic liberal institutions. These sub-indices represent the intersection of populist policies (economic or institutional) with populist motives.
A high populist index indicates that the implementation of populist policies, such as income distribution, is driven by populist reasons. Unlike other indices, this construct examines whether populist rhetoric translates into action and whether the action results from populist motives. In summary, while most populist indices measure the extent of populist rhetoric, this index expands its scope to include active populism as measured by institutional and economic policies, while at the same time allowing the research to just loo at rehtoric if he os she wishes to do so. The index allows for a dual interpretation: the extent to which populist policies are enacted for populist reasons and how much populist rhetoric translates into policy action.
$POP=POP_R⋅(EP+IP)=(POP_R⋅EP)+(POP_R⋅IP)=(PEP+PIP)$
By aligning populist policies with populist rhetoric, the index can differentiate between non-populist regimes implementing populist policies and populist regimes not doing so. This detailed information allows for the analysis of various scenarios, including (Table 1):
Table 1. Latin American Left-Leaning Populist Index scenarios
| Scenario | Index value |
|---|---|
| Overall effect of active populism | POP |
| Economic populism | High EP and low POP |
| Institutional populism | High IP and low POP |
| Non-active populism | High POP_R and low EP and IP |
| Populist economic populicies by non-populists | Low POP_R and high IP |
| Populist institutional policies by non-populists | Low POP_R and high EP |
Estimation
The rhetoric measure (POP_R) is V-Party’s Populism Index, which ranges from 0 (less populism) to 1 (more populism). This measure calculates the harmonic mean of “anti-elitism” and “people-centrism.” The index assesses the degree to which representatives of a political party use populist rhetoric (narrowly defined). Using V-Party’s populism index allows for coverage of a wide range of countries and years.
The V-Party measures populism at the political party level. Each year, POP_R reflects the V-Party value for the President’s party. If a new president takes office, POP_R uses the value of the President who served longer that year. Years without data are interpolated when possible.
Economic Populism is the simple average of four policy variables. Additionally, each $EP_i$ has more than one source.
| Definition | Term | Inputs |
|---|---|---|
| Economic populism | $EP$ | $EP = \frac{EP_1 + EP_2 + EP_3 + EP_4}{4}$ |
| Business and labor market regulatoins | $EP_1$ | $EP_1 = \frac{EP_{11} + EP_{12} + EP_{13}}{3}$ |
| Government interference | $EP_2$ | $EP_2 = \frac{EP_{21} + EP_{22}}{2}$ |
| Monetary and financial freedom | $EP_3$ | $EP_3 = \frac{EP_{31} + EP_{32} + EP_{33}}{3}$ |
| Freedom to trade | $EP_4$ | $EP_4 = \frac{EP_{41} + EP_{42}}{2}$ |
The next table lists the source, variable name, and variable code for each input to EP (where IEF stands for Heritage Foundation’s Index of Economic Freedom and EFW stands for Fraser Institute’s Economic Freedom of the World)
| Sub-index | Source | Variable | Variable code |
|---|---|---|---|
| $EP_{11}$ | IEF | Business freedom | Business freedom |
| $EP_{12}$ | EFW | Labor market regulations | 5A |
| $EP_{13}$ | EFW | Business regulations | 5C |
| $EP_{21}$ | EFW | Transfers and subsidies | 1B |
| $EP_{22}$ | EFW | State ownership | 1E |
| $EP_{31}$ | IEF | Monetary freedom | Monetary freedom |
| $EP_{32}$ | IEF | Financial freedom | Financial freedom |
| $EP_{33}$ | EFW | Foreign currency and bank accounts | 3D |
| $EP_{41}$ | IEF | Trade freedom | Trade freedom |
| $EP_{42}$ | EFW | Freedom to trade internationally | 4 |
Institutional Populism looks at five (5) institutional variables typically ob-served in populist regimes. IP is the simple average of these five variables. When available, the index uses more than one source.
| Definition | Term | Inputs |
|---|---|---|
| Institutional populism | $IP$ | $IP = \frac{IP_1 + IP_2 + IP_3 + IP_4 + IP_5}{5}$ |
| Rule of law | $IP_1$ | $IP_1 = \frac{IP_{11} + IP_{12} + IP_{13}}{3}$ |
| Corruption | $IP_2$ | $IP_2 = \frac{IP_{21} + IP_{22}}{2}$ |
| Neopatrimonialism | $IP_3$ | $IP_3 = IP_{31}$ |
| Freedom of expression | $IP_4$ | $IP_4 = IP_{41}$ |
| Property rights | $IP_5$ | $IP_5 = IP_{51}$ |
Sources, variables names, and variable codes for IP are included in the next table.
| Sub-index | Source | Variable | Variable code |
|---|---|---|---|
| $IP_{11}$ | V-Dem | Rule of law | v2x_rule |
| $IP_{12}$ | V-Dem | Judiciary constraints on the executive | v2x_jucon |
| $IP_{13}$ | V-Dem | Legislative constraints on the executive | v2xlg_legcon |
| $IP_{21}$ | V-Dem | Corruption | 2x_execorr |
| $IP_{22}$ | IEF | Government Integrity | Government integrity |
| $IP_{31}$ | V-Dem | Neopatrimonialism | 2x_neopat |
| $IP_{41}$ | V-Dem | Freedom of expression | v2mecenefm_osp |
| $IP_{51}$ | IEF | Property rights | Property rights |
Results and selected data
Index results are consistent with countries that the literature already identifies as populist regimes (Celico et al., 2024; Funke et al., 2023). The next table presents index values and rankings for all countries with data in 2018. The ranking aligns with existing literature. For example, Venezuela, Bolivia, Nicaragua, and Ecuador ranked high in 2018. This year, Argentina ranks lower as Macri’s Cambiemos centrist political coalition was governing at the time.

This table illustrates an additional characteristic of the index. Given that populist policies are measured on a scale from 0 (indicating less populism) to 100 (indicating more populism) and adjusted by POP_R, which ranges between 0 and 1, the index values for PEP and PIP are expected to be relatively low. This is evident in the significant gap between the index values for Venezuela and Bolivia, the latter being the next country in the ranking.
The index indicates that populist regimes score higher on the Institutional Populism (PIP) sub-index compared to the Economic Populism (PEP) sub-index (Figure 2). This disparity may be attributable to the variables contributing to each sub-index.
Looking at a time series for the region, the data shows an upward trend in the early 2000s, peaking between 2009 and 2014.


Index limitations
Country and time coverage
The first limitation to consider is the index coverage, which is limited to Latin American countries (aproximately 21) with consistent data starting in 2000. This means that the index starts just as the new wave of left-leanining populist regimes take office. This imposes a limit on long-treand of populist changes in the region.
Ideological coverage
The index focuses on left-leaning populist regimes, so far the most prevalent type in the region. The current version of the index does not include a righ-wing (or non-left) populist version.
As much as we would like to have the index cover this type of populist regimes as well, this remains a pending point of development.
Missing observations
While we can interpolate some missing POP_R observations, in some cases this is not possible. The most common reason for missing observations in POP_R are years with independetn presidents without a political party affiliation, for which there is no V-Party data.
Limited sub-index comparison
EP and IP range from 0 to 100, but their particular values are not necesarrily comparable. IP can move up or down, as does EP, but differnet values do not allow an easy intepretation in the sense of whether a populist is more economic or institutionally inense.