Documentation
Using LALLPI in your research? See how to cite this index.
For a variable-by-variable reference, see the Codebook.
Conceptualization
The Latin American Left-Leaning Populism Index (LALLPI) measures active left-leaning populism by combining populist rhetoric with populist policy. This lets the index distinguish between (a) leaders who use populist rhetoric without matching action, and (b) typically populist policies enacted by non-populist leaders. Two governments may share similar populist rhetoric while only one pursues corresponding policy change; conversely, two leaders may enact similar policies – income redistribution, say – for different reasons, with only one of them populist in motive.
The index combines a measure of populist rhetoric (POP_R) with a measure of populist policy. In its simplest form, the index (POP) is rhetoric × policy, where rhetoric ∈ [0, 1] and policy ∈ [0, 100], both increasing in populism.
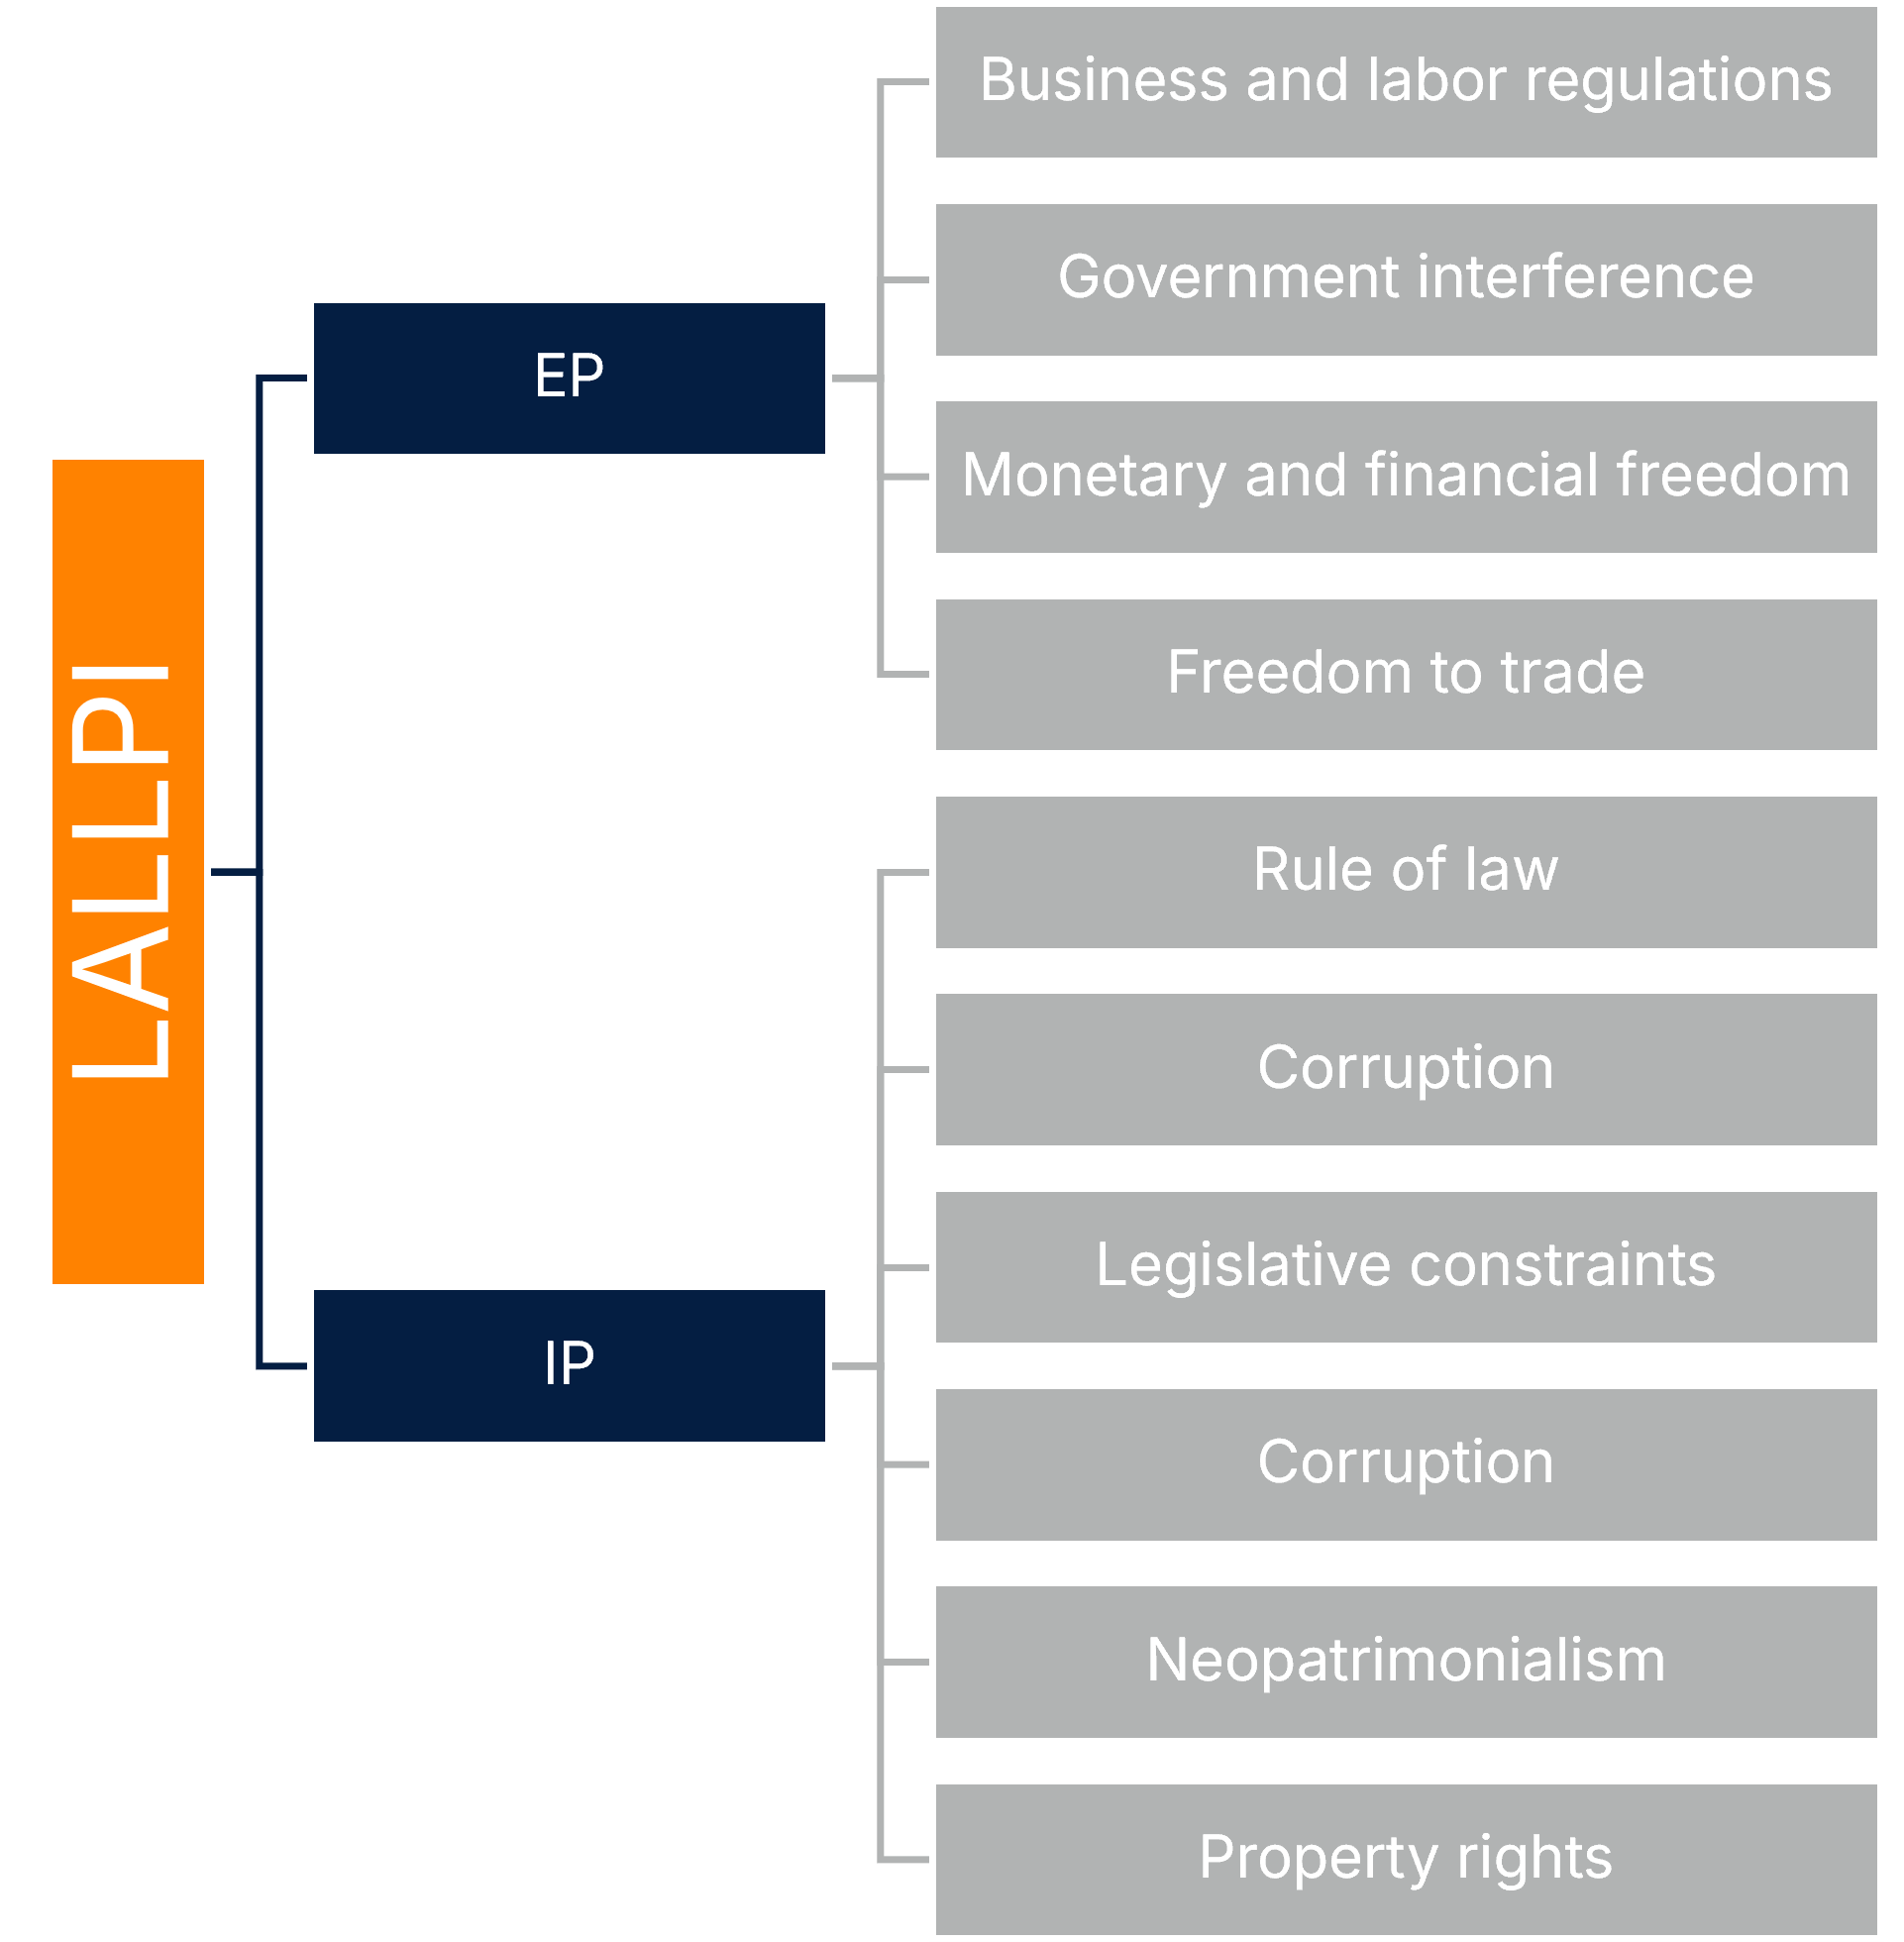
Active populism comprises two sub-indices – Economic Populism (EP) and Institutional Populism (IP) – capturing the economic and political dimensions of populist regimes separately. EP covers the economic policies typical of populist regimes; IP covers actions against the rule of law and liberal-democratic institutions. Each sub-index reflects the intersection of populist policy (economic or institutional) with populist motive specifically.
A high index value means populist-style policy – income redistribution, for instance – is being driven by populist motives, not merely correlated with them. Unlike indices that measure rhetoric alone, LALLPI asks whether rhetoric translates into action and whether that action is itself populist-motivated, while still letting a researcher isolate rhetoric on its own if that’s all they need. The index therefore supports two readings at once: how much enacted policy is populist-motivated, and how much populist rhetoric actually becomes policy.
\[ POP = \frac{POP_R \cdot (EP + IP)}{2} = \frac{(POP_R \cdot EP) + (POP_R \cdot IP)}{2} = \frac{PEP + PIP}{2} \]
By pairing populist policy with populist rhetoric, the index distinguishes non-populist regimes that happen to implement populist-style policy from populist regimes that do not. This supports several distinct readings of the same underlying data (Table 1):
| Scenario | Index value |
|---|---|
| Overall effect of active populism | POP |
| Economic populism | High EP and low POP |
| Institutional populism | High IP and low POP |
| Non-active populism | High POP_R and low EP and IP |
| Populist economic policies by non-populists | Low POP_R and high IP |
| Populist institutional policies by non-populists | Low POP_R and high EP |
Estimation
Every calculation described below is implemented in full in the project’s open-source pipeline – see the Data page to browse the code and verify any step directly, rather than relying on this description alone.
The rhetoric measure (POP_R) is V-Party’s Populism Index, ranging from 0 (less populist) to 1 (more populist). It is the harmonic mean of “anti-elitism” and “people-centrism,” and captures how much a political party’s representatives use populist rhetoric in this narrow sense. Using V-Party’s populism index gives the index broad country and year coverage.
V-Party measures populism at the party level. Each year, POP_R takes the value of the president’s party; when a new president takes office mid-year, POP_R uses the value for whichever president served longer that year. Missing years are interpolated where possible.
Economic Populism is the simple average of four policy variables, each itself drawn from more than one source.
| Definition | Inputs |
|---|---|
| Economic populism | \(EP = (EP_1 + EP_2 + EP_3 + EP_4)/4\) |
| Business and labor market regulations | \(EP_1 = (EP_{11} + EP_{12} + EP_{13})/3\) |
| Government interference | \(EP_2 = (EP_{21} + EP_{22})/2\) |
| Monetary and financial freedom | \(EP_3 = (EP_{31} + EP_{32} + EP_{33})/3\) |
| Freedom to trade | \(EP_4 = (EP_{41} + EP_{42})/2\) |
The next table lists the source, variable name, and variable code for each input to EP (IEF: Heritage Foundation’s Index of Economic Freedom; EFW: Fraser Institute’s Economic Freedom of the World).
| Sub-index | Source | Variable | Variable code |
|---|---|---|---|
| \(EP_{11}\) | IEF | Business freedom | Business freedom |
| \(EP_{12}\) | EFW | Labor market regulations | 5B |
| \(EP_{13}\) | EFW | Business regulations | 5C |
| \(EP_{21}\) | EFW | Transfers and subsidies | 1B |
| \(EP_{22}\) | EFW | State ownership | 1E |
| \(EP_{31}\) | IEF | Monetary freedom | Monetary freedom |
| \(EP_{32}\) | IEF | Financial freedom | Financial freedom |
| \(EP_{33}\) | EFW | Foreign currency and bank accounts | 3D |
| \(EP_{41}\) | IEF | Trade freedom | Trade freedom |
| \(EP_{42}\) | EFW | Freedom to trade internationally | 4 |
Institutional Populism is the simple average of six institutional variables commonly observed in populist regimes.
| Definition | Inputs |
|---|---|
| Institutional populism | \(IP = (IP_1 + IP_2 + IP_3 + IP_4 + IP_5 + IP_6)/6\) |
| Rule of law | \(IP_1 = (IP_{11} + IP_{12} + IP_{13})/3\) |
| Corruption | \(IP_2 = (IP_{21} + IP_{22})/2\) |
| Legislative constraints | \(IP_3 = IP_{31}\) |
| Corruption | \(IP_4 = IP_{41}\) |
| Neopatrimonialism | \(IP_5 = IP_{51}\) |
| Property rights | \(IP_6 = IP_{61}\) |
| Sub-index | Source | Variable | Variable code |
|---|---|---|---|
| \(IP_{11}\) | V-Dem | Rule of law | v2x_rule |
| \(IP_{12}\) | V-Dem | Judiciary constraints on the executive | v2x_jucon |
| \(IP_{13}\) | V-Dem | Legislative constraints on the executive | v2xlg_legcon |
| \(IP_{21}\) | V-Dem | Corruption | v2x_execorr |
| \(IP_{22}\) | IEF | Government integrity | Government integrity |
| \(IP_{31}\) | V-Dem | Legislative constraints on the executive | v2xlg_legcon |
| \(IP_{41}\) | V-Dem | Corruption | v2x_execorr |
| \(IP_{51}\) | V-Dem | Neopatrimonialism | v2x_neopat |
| \(IP_{61}\) | IEF | Property rights | Property rights |
Results and selected data
Index results are consistent with regimes the literature already identifies as populist (Celico et al., 2024; Funke et al., 2023). The table below presents index values and rankings for every country with data in 2018. Consistent with the literature, Venezuela, Bolivia, Nicaragua, and Ecuador rank highest that year; Argentina ranks lower, reflecting Macri’s centrist Cambiemos coalition in government at the time.
| Country | Overall populism | Economic populism | Institutional populism | Populist rhetoric |
|---|---|---|---|---|
| 79.8 (1) | 69.5 | 92.4 | 0.99 | |
| 45.5 (2) | 36.5 | 68.6 | 0.87 | |
| 40.3 (3) | 28.4 | 88.6 | 0.69 | |
| 38.4 (4) | 38.4 | 48.2 | 0.89 | |
| 27.5 (5) | 23.8 | 52.6 | 0.72 | |
| 14.5 (6) | 30.0 | 31.4 | 0.47 | |
| 12.9 (7) | 23.8 | 18.5 | 0.61 | |
| 11.5 (8) | 38.1 | 24.3 | 0.37 | |
| 10.5 (9) | 30.9 | 12.9 | 0.48 | |
| 10.4 (10) | 22.7 | 41.2 | 0.33 | |
| 9.8 (11) | 28.0 | 21.9 | 0.39 | |
| 8.1 (12) | 35.2 | 40.6 | 0.21 | |
| 7.2 (13) | 24.9 | 23.4 | 0.30 | |
| 7.2 (14) | 24.4 | 56.2 | 0.18 | |
| 6.5 (15) | 27.3 | 71.2 | 0.13 | |
| 6.2 (16) | 26.4 | 58.1 | 0.15 | |
| 6.2 (17) | 37.9 | 36.7 | 0.17 | |
| 5.5 (18) | 28.9 | 50.2 | 0.14 | |
| 2.6 (19) | 24.9 | 68.1 | 0.06 | |
| 2.4 (20) | 20.0 | 11.8 | 0.15 |
Because policy scores run from 0 (less populist) to 100 (more populist) and are scaled by POP_R (0 to 1), PEP and PIP values tend to be modest in absolute terms – visible in the gap between Venezuela and Bolivia, the next-ranked country.
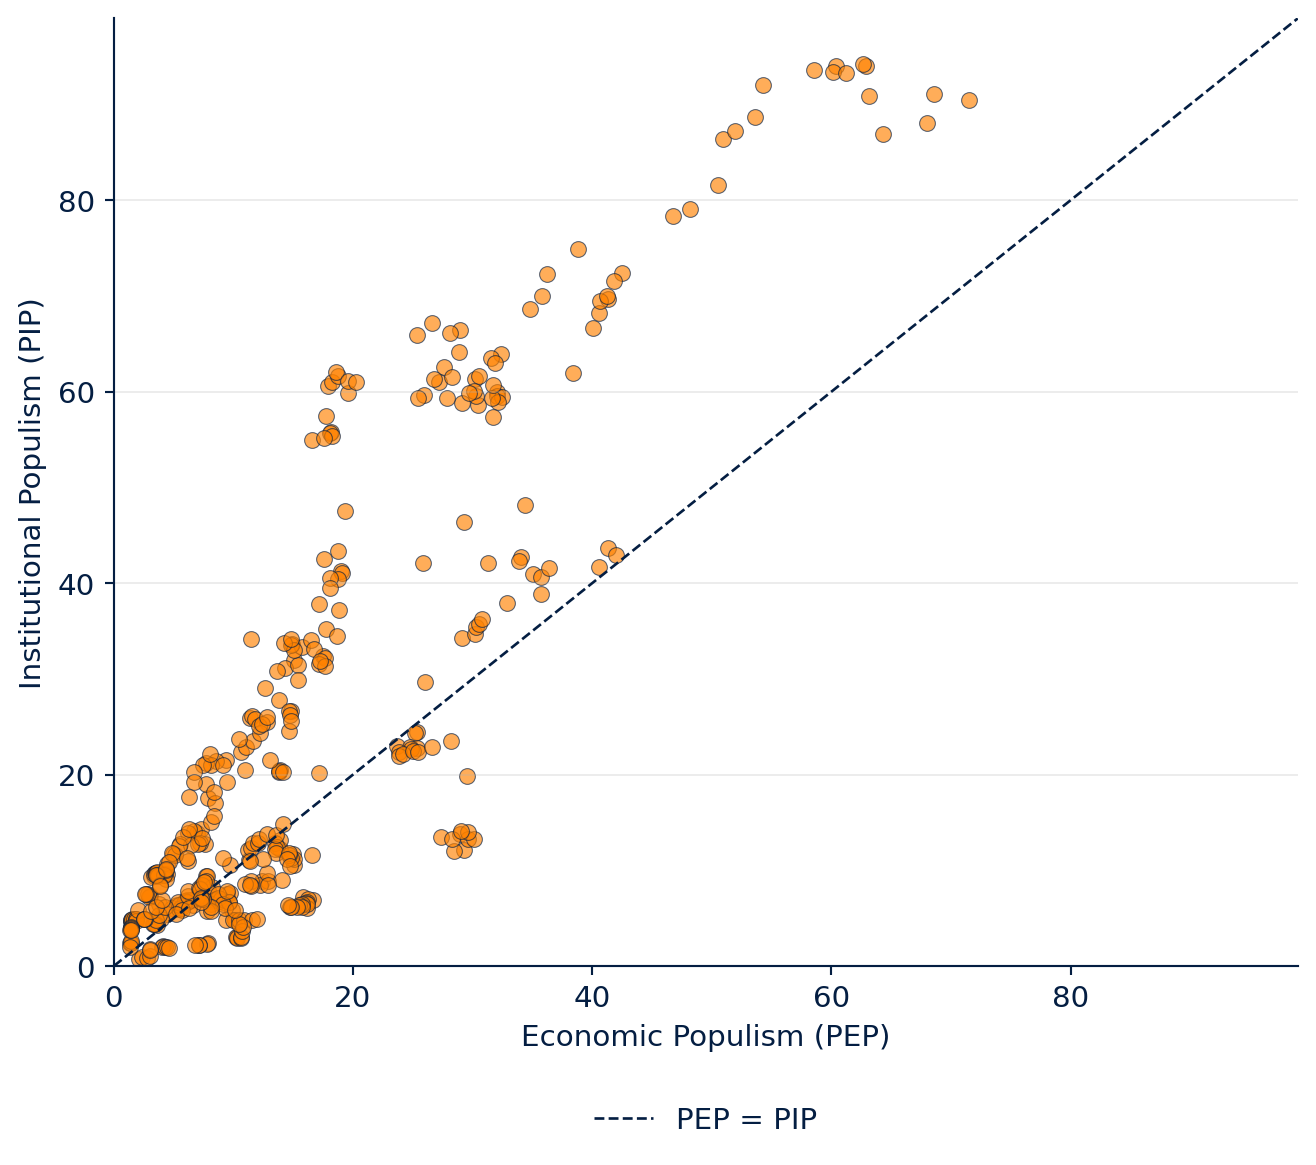
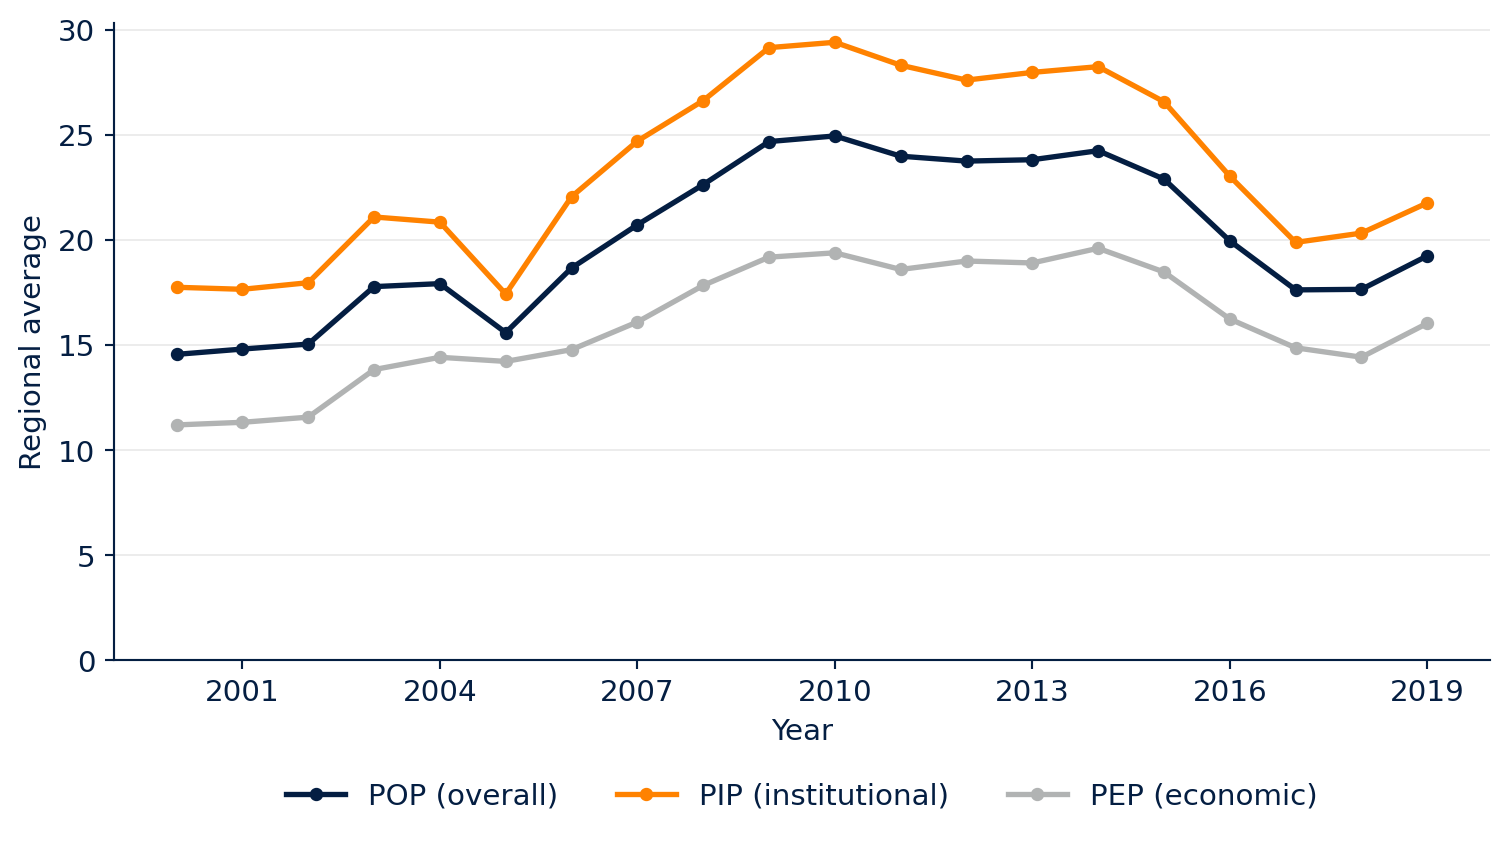
Populist regimes tend to score higher on Institutional Populism (PIP) than on Economic Populism (PEP) (Figure 2), across the full 2000-2020 panel and not just in 2018. This may reflect which underlying variables feed each sub-index.
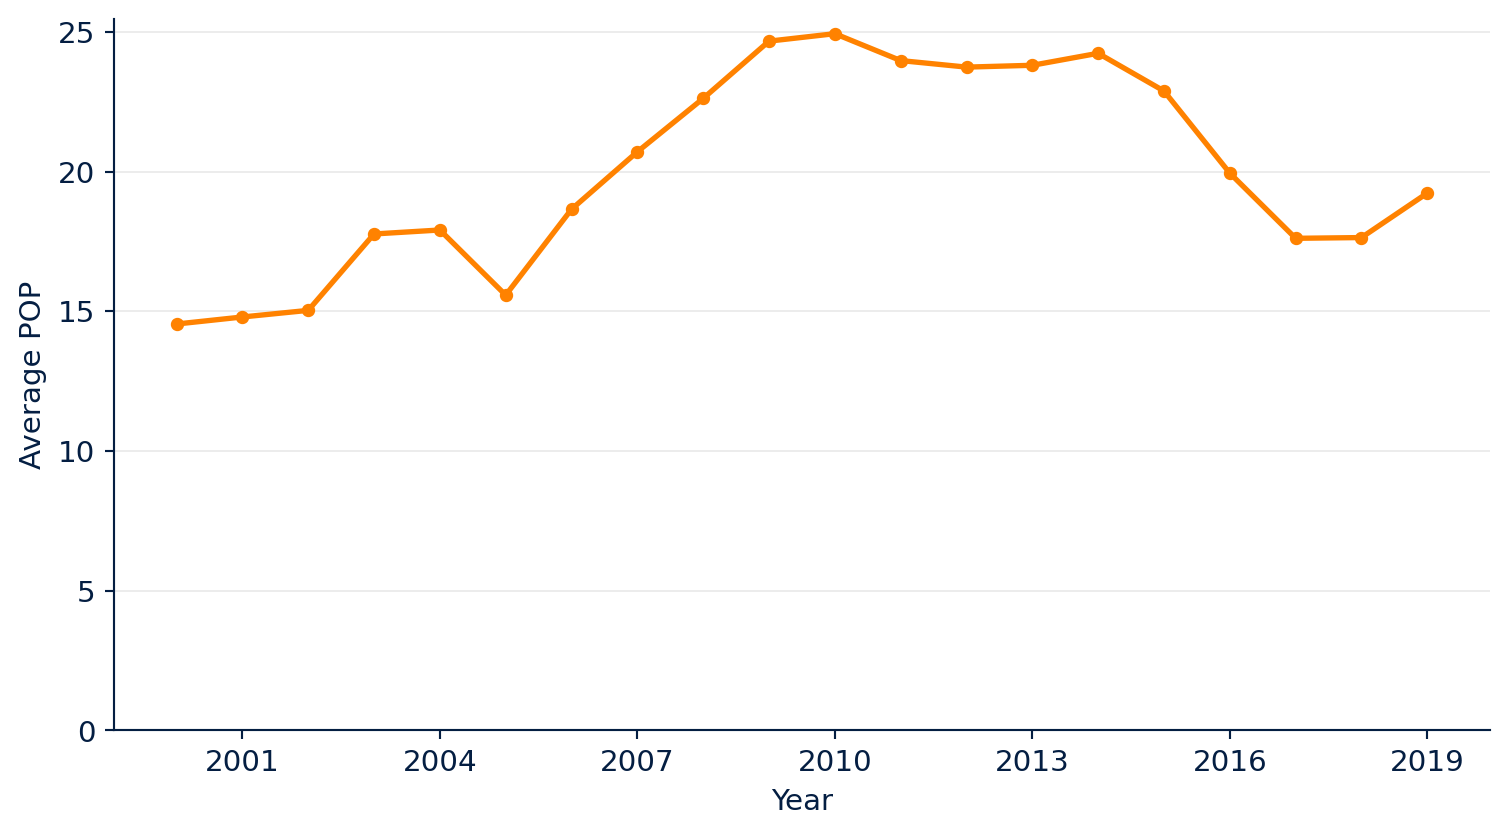
Looking at the region over time, the data show an upward trend in the early 2000s, peaking between 2009 and 2014, before declining.
Index limitations
Country and time coverage
The index’s first limitation is coverage: it is limited to Latin American countries – 22 with a complete score in any given year – starting in 2000. This means the index begins just as the region’s recent wave of left-leaning populist regimes was taking office, which limits any analysis of longer-run trends in populism.
Ideological coverage
The index currently covers only left-leaning populism, the most prevalent type observed in the region to date. It does not yet cover right-wing or other non-left populism. Extending the index to those cases remains a planned area of future development.
Missing observations
Some missing POP_R observations can be interpolated; others cannot. The most common cause of a missing POP_R value is a president without party affiliation (an “independent”), for whom V-Party has no data.
Limited sub-index comparison
EP and IP both range from 0 to 100, but their values are not directly comparable to each other. Each can move independently of the other, so a given value does not by itself indicate whether a regime’s populism is more economic or more institutional in character.
Report a bug or submit a recommendation
Found an error in the methodology, or have a suggestion? Report it on GitHub.